_edited.png)
Formula to Calculate Attrition Rate for Engineering Teams
Your board deck shows 7% annual attrition across a 60-engineer organization. The number looks controlled. Then you review the departures and find that two staff platform engineers who owned payments and search have left. The company replaced one role immediately, left the other open, and counted contractors whose engagements ended in the same reporting period. The headline percentage didn't lie, but it failed to describe the engineering risk.
That's the problem with treating the formula to calculate attrition rate as an HR exercise. The arithmetic is straightforward. The hard part is defining the population, the departure types, and the denominator so the result reflects the team you need to protect.
Table of Contents
What Attrition Rate Actually Means on an Engineering Team - Attrition, turnover, and churn are not interchangeable
The Canonical Formula Step by Step - Define the four inputs - Keep the population clean
Four Common Variants and When to Use Each - Basic period attrition - Annualized attrition - Regrettable attrition - Voluntary and involuntary views
Worked Examples You Can Drop into a Spreadsheet - Example one, a 20-engineer team - Example two, a 75-engineer team with contractor churn - Example three, a 200-engineer team in rapid expansion
Interpreting the Number Without Fooling Yourself - Five checks before you react - Segment before diagnosing
What Attrition Rate Actually Means on an Engineering Team
Attrition rate is the share of employees who leave a defined group during a defined period, expressed as a percentage. The standard operational structure is departures divided by average headcount, multiplied by 100, as described in this attrition-rate calculation reference.
For a CTO, the phrase “defined group” carries more weight than it does in a generic company report. A platform team, an application team, and an embedded infrastructure group can have very different risk profiles even when they sit inside the same engineering organization. A single companywide figure can hide the loss of scarce knowledge, ownership of critical systems, or leadership capacity.
Attrition, turnover, and churn are not interchangeable
Organizations often use attrition, turnover, and churn as if they mean the same thing. They don't.
Attrition generally describes people leaving the workforce or a defined team. Some HR frameworks use it specifically for unreplaced departures.
Turnover often includes departures where the role is refilled, so it captures replacement activity as well as exits.
Churn is a broader operational description of repeated movement in and out of a team or organization.
That distinction changes the management question. If an engineer leaves and you backfill the position immediately, the headcount may remain stable, but the team still absorbs recruiting work, onboarding time, knowledge transfer, and delivery disruption. A stable headcount can coexist with significant turnover and recruiting load, a distinction also discussed in this guide to attrition-rate definitions.
Contractors ending engagements, interns who don't convert, internal transfers, layoffs, and rapid hiring can further blur the count. A contractor departure may matter to delivery capacity without belonging in a full-time employee attrition rate. An internal transfer may create a vacancy for one engineering manager while preserving the employee relationship at the company.
Practical rule: Never put an attrition percentage in front of a CTO without naming the population, period, departure definition, and replacement status.
The same arithmetic can therefore produce different management conclusions. A basic employee attrition rate may show workforce movement. A regrettable rate may show the loss of people you wanted to keep. A team-level view may reveal that the actual risk sits in one platform group, not across engineering.
If departures are connected to workload, progression, or management experience, qualitative context matters too. A useful companion resource is common reasons employees leave a job, especially when the rate tells you where to investigate but not why people exited.
The Canonical Formula Step by Step
Use this standard formula when you need a consistent starting point:
Attrition Rate = (Number of Leavers in Period ÷ Average Headcount in Period) × 100
The structure is widely used across HR analytics and turnover reporting, including HiBob's explanation of how to measure attrition.
Define the four inputs
Number of leavers is the count of people who departed from the population during the period. For a total employee attrition view, include voluntary and involuntary departures. Exclude internal transfers if the metric is meant to measure people leaving the company rather than leaving a team. Decide separately how to treat retirements, reductions in force, and fixed-term contracts, then document the rule.
Average headcount is usually calculated as:
Average Headcount = (Start Headcount + End Headcount) ÷ 2
This denominator normalizes workforce changes. If an engineering group starts a period with 40 employees and ends with 60, its average headcount is 50 under the standard start-and-end method. That prevents the ending headcount from making the team appear larger throughout the entire period.
For a volatile team that hires and loses people frequently, a monthly average can be more representative. Add each month's headcount and divide by the number of months measured. Use that approach consistently if you choose it, because changing denominator methods between quarters makes trend comparisons unreliable.
Period is the reporting window. The standard formula can be applied monthly, quarterly, or annually, as noted in this HR calculation guide. Don't mix a quarterly numerator with an annual denominator.
Keep the population clean
If the report measures full-time engineering employees, use full-time engineering headcount in the denominator and count departures from that same group. Contractors should sit in a separate contractor movement view unless your stated purpose is total delivery-capacity attrition.
For a team that grows from 40 to 60, record the start headcount as 40, the end headcount as 60, and the period leavers independently. New hires affect the ending headcount, but they aren't leavers and shouldn't be added to the numerator.
A spreadsheet can use this simple structure:
Format the result as a percentage if the cell stores the decimal version, or use the multiplied formula when you want the numeric percentage directly.
Four Common Variants and When to Use Each
The canonical formula is useful, but engineering leaders usually need more than one view. Pick the variant that matches the decision. Don't create a complicated dashboard just because the data exists.
Variant | Formula | When to Use | Engineering Example |
|---|---|---|---|
Basic period attrition | Establish a consistent monthly, quarterly, or annual workforce movement view | Measure employee departures across a platform organization | |
Annualized attrition for partial-year reporting | , then apply a documented annualization method | Estimate a full-year direction when a review occurs before the year closes | Give a mid-quarter QBR a comparable planning signal without presenting it as a completed annual result |
Regrettable attrition | Focus on people the organization wanted to retain | Isolate the loss of high-performing staff engineers from a platform group | |
Voluntary versus involuntary attrition | Separate retention problems from workforce decisions made by the employer | Compare resignation patterns with layoffs or performance-related exits |
Basic period attrition
Use the basic view when you need a stable operating metric. Its strength is comparability. Its weakness is that it blends departures with different business consequences. A resignation by a consistently underperforming employee and a resignation by the only engineer who understands a payment service both count as one departure.
Annualized attrition
Annualization helps leaders reason about an incomplete reporting period, but it can create false precision. A short-term spike may reflect a reorganization, a project ending, or a seasonal staffing pattern. Label the result as an estimate, preserve the actual period beside it, and never use annualized output as if it were an observed full-year rate.
Regrettable attrition
Regrettable attrition requires a written classification rule. Define it before reviewing individual departures, or managers may label every difficult loss as regrettable and make the metric political. Useful inputs include role criticality, performance, succession depth, and the time required to restore equivalent capability.
Voluntary and involuntary views
These variants lead to different actions. Voluntary departures may prompt stay interviews, compensation review, workload analysis, or a career-path discussion. Involuntary departures may point to hiring quality, performance management, restructuring, or role design. BambooHR's turnover-rate guidance also describes counting departures within a defined period and using average headcount.
TekRecruiter typically reports the basic and regrettable variants together. The headline number shows how much movement occurred. The regrettable view helps a CTO decide which losses deserve immediate intervention.
Worked Examples You Can Drop into a Spreadsheet
The safest spreadsheet is the one another person can audit without reconstructing your assumptions. Use separate columns for start headcount, end headcount, departures, population, and period. Keep contractors on their own row or worksheet when they aren't part of the employee metric.
Example one, a 20-engineer team
Suppose a team begins a quarter with 20 engineers, ends with 20, and records four employee departures. The average headcount is . The basic quarterly attrition calculation is .
Use cells like these:
B2, Start Headcount: 20
C2, End Headcount: 20
D2, Leavers: 4
E2, Period: Quarter
F2, Average Headcount:
G2, Attrition Rate:
This is basic period attrition. If all four departures were voluntary and two were designated regrettable under your policy, create separate numerator cells rather than changing the primary result.
Example two, a 75-engineer team with contractor churn
Assume the employee population starts at 70 and ends at 80, with five full-time employee departures. The average employee headcount is , so employee attrition is , or 6.67%.
Now suppose the team also has 10 contractors at the start and 15 at the end, with contractor engagements ending during the quarter. Don't add those contractor exits to the employee numerator if the metric is full-time employee attrition. Report contractor movement separately, using a clearly labeled contractor population and denominator.
A role that is backfilled also shouldn't be double-counted. Count the departure once. Count the replacement as a hiring or turnover event, not as another departure.
For spreadsheet tracking, the employee row might use:
Start Headcount: 70
End Headcount: 80
Average Headcount: 75
Employee Leavers: 5
Period: Quarter
Attrition Rate: 6.67%
You can apply the same discipline to operational attendance data with a separate guide to tracking PTO in Excel. The principle is identical, keep definitions visible and inputs auditable.
Example three, a 200-engineer team in rapid expansion
Suppose a scaling engineering organization starts the year with 140 engineers, ends with 260, and records 18 employee departures. The standard average headcount is . The annual attrition rate is , consistent with the worked calculation described by HiBob's attrition glossary.
That result is useful, but rapid scaling makes the denominator choice especially important. Using the ending headcount of 260 would understate movement because the organization did not have 260 engineers throughout the year. If monthly headcount data is available, compare the start-and-end average with a monthly average and record which method drives the executive report.
Scenario | Avg Headcount | Leavers | Period | Attrition Rate |
|---|---|---|---|---|
20-engineer team | 20 | 4 | Quarter | 20% |
75-engineer team, employees only | 75 | 5 | Quarter | 6.67% |
200-engineer team, rapid expansion | 200 | 18 | Year | 9% |
Interpreting the Number Without Fooling Yourself
A percentage doesn't identify a problem by itself. A 10% rate can be manageable in a stable 50-person team, while the same rate can threaten a 12-person team responsible for a critical platform. The percentage describes proportion, not replaceability, knowledge concentration, customer impact, or delivery risk.
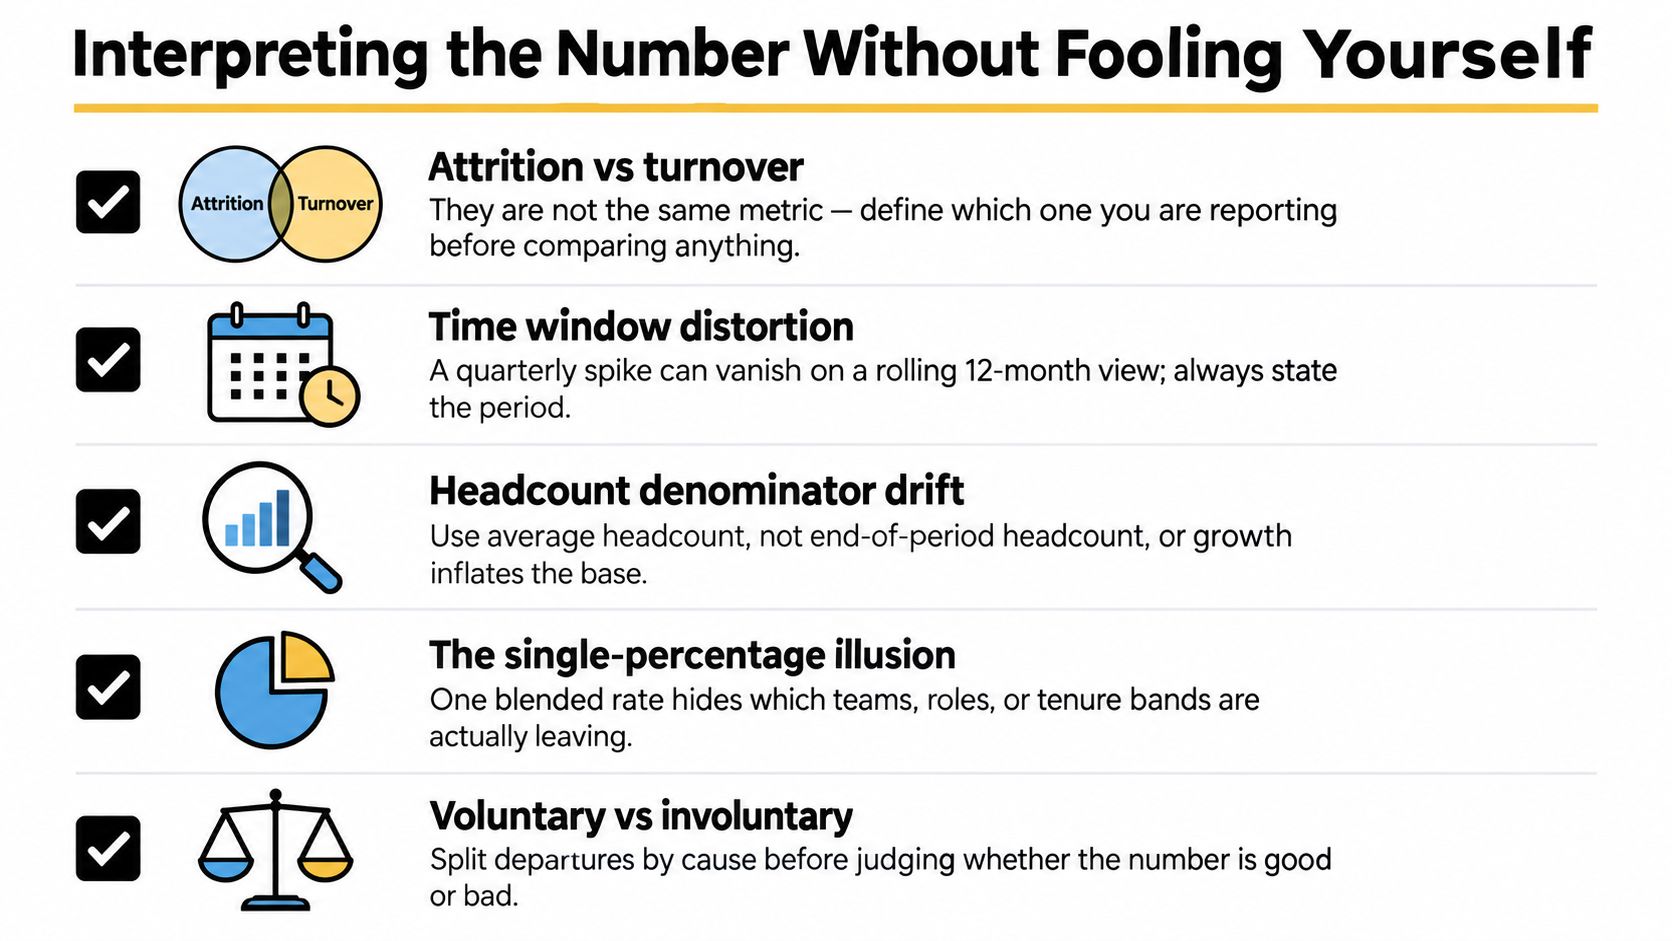
Five checks before you react
Attrition versus turnover: Confirm whether your report counts departures, replaced departures, or both. The distinction affects vacancy planning and recruiting workload.
Time window: State whether the result covers a month, quarter, year, or rolling period. A quarterly spike can disappear in a longer view, but that doesn't make the spike irrelevant.
Denominator drift: Use average headcount for the measured period. Rapid growth can distort the result if you divide by ending headcount.
Blended populations: Separate full-time employees, contractors, interns, and internal transfers before drawing conclusions.
Departure quality: Split voluntary and involuntary departures, then identify regrettable losses and concentration by team.
Segment before diagnosing
A flat companywide number hides patterns. Break the data down by function, role, level, tenure, manager, and location where privacy and sample size allow. A high rate among recently hired engineers suggests a different investigation from repeated departures among senior platform owners.
Tenure-weighted views can expose what a flat percentage misses. Group departures by early tenure, established employees, and long-serving specialists, then compare the pattern with onboarding quality, role clarity, promotion paths, manager changes, and workload. Don't assume the data proves a cause. It tells you where to test a hypothesis.
Internal transfers deserve separate treatment too. If an engineer moves from infrastructure to product, the company retained the person but lost capacity in the original team. Counting that movement as company attrition would misstate retention. Excluding it from every operational view would hide a staffing gap. Maintain a company attrition measure and a team mobility measure instead.
A useful companion metric is quality of hire, because retention patterns can reveal whether hiring decisions and role expectations align. This guide to quality-of-hire metrics helps connect post-hire outcomes with recruiting evaluation rather than treating attrition as an isolated HR statistic.
The question isn't whether the percentage looks low. The question is whether the departures weaken a capability your roadmap depends on.
How CTOs and HR Leaders Should Track and Act on It
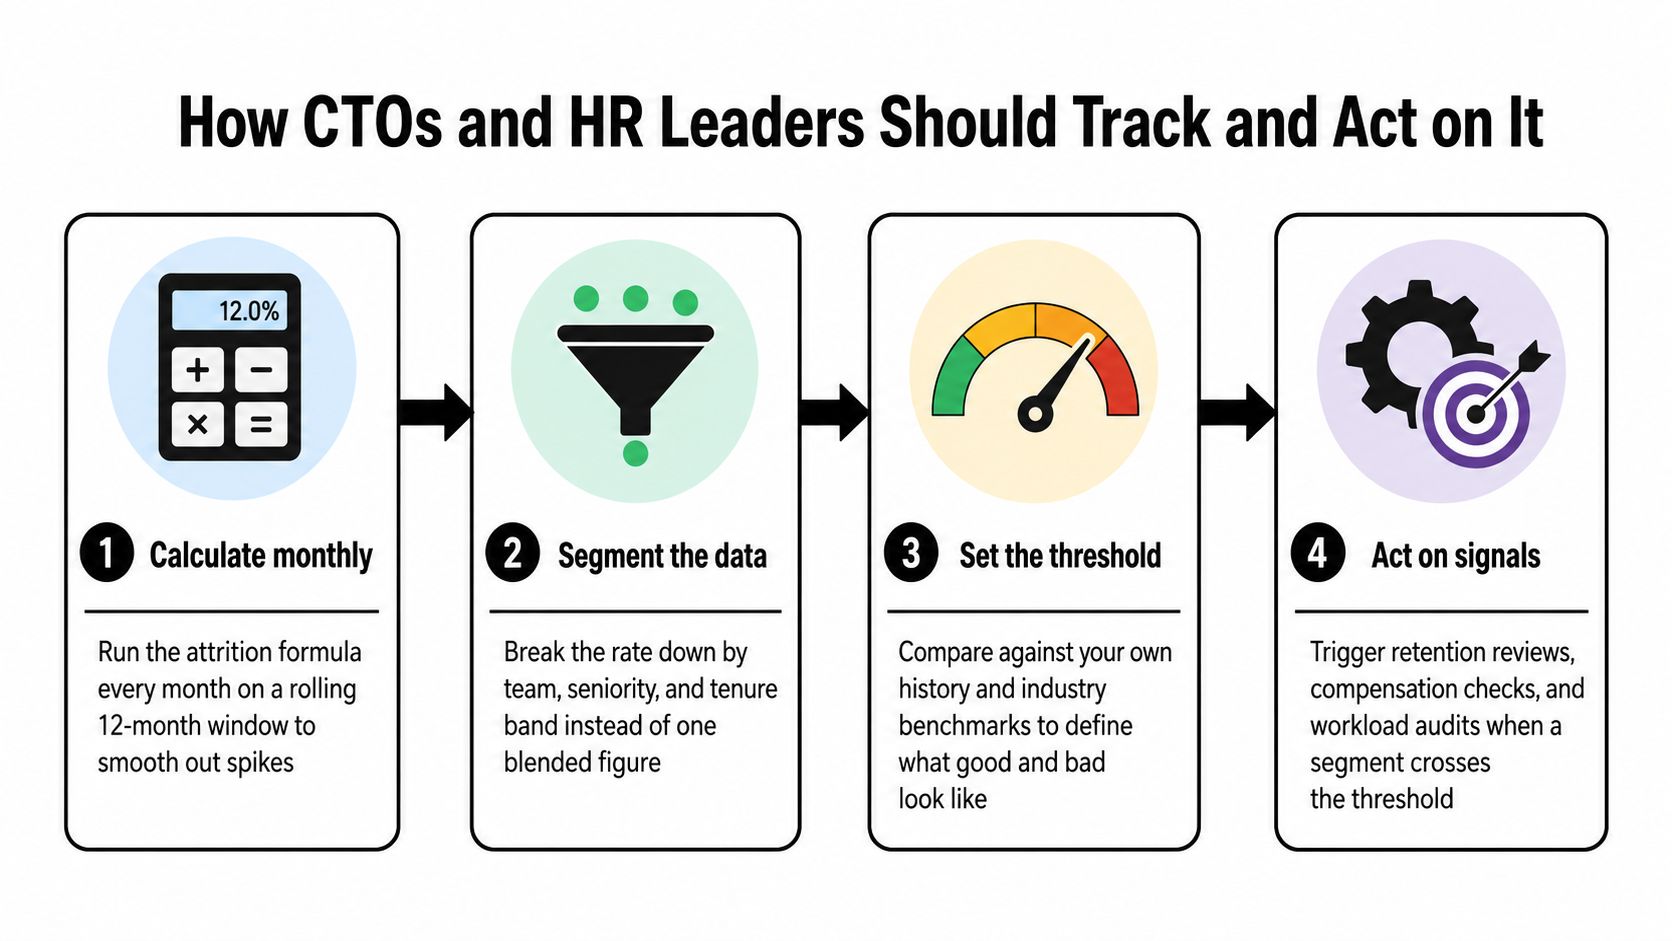
A practical operating rhythm is to calculate attrition monthly, review it on a rolling 12-month basis, and report the segments that changed. The rolling view smooths isolated movement, while the monthly view preserves the signal that a longer average can hide.
Track at least these cuts:
Team: Platform, application, data, security, and other delivery groups.
Level: Individual contributor and management levels, with seniority bands that match your organization.
Tenure: Early-tenure, established, and long-serving employees.
Cause: Voluntary, involuntary, internal transfer, contractor completion, and regrettable status.
Criticality: Roles tied to production ownership, customer commitments, security, or roadmap dependencies.
Set an action protocol before the dashboard becomes a debate. In this operating model, a segment crossing 15% voluntary attrition, replacement time extending beyond 45 days, or one role losing two engineers in a quarter triggers a review. Those thresholds are management rules, not universal benchmarks. Compare them with your own history and the capacity risk of the affected team.
A threshold should create a specific response:
Retention review: Run stay interviews with remaining engineers and inspect manager, workload, and career signals.
Compensation check: Compare pay positioning, promotion timing, and offer declines for the affected role.
Sourcing pivot: Change the search profile, channels, geography, or employment model if the pipeline cannot replace the capability.
Contractor bridge: Add temporary capacity when delivery risk arrives before a permanent hire.
Roadmap adjustment: Reorder work when the team no longer has safe ownership coverage.
The formula only matters when someone owns the response. HR can maintain definitions and data quality. Engineering leaders can assess technical criticality. Recruiting can translate flagged roles into an active pipeline. For a broader view of connecting retention measurement with hiring outcomes, review this resource on how to improve retention with QoH metrics.
A short visual explanation can reinforce the operating cadence:
Putting the Formula to Work With Teks Engineering Talent
The formula becomes useful when it feeds recruiting decisions before a team misses a delivery commitment. Start with a documented population, clean monthly headcount, departure records, contractor status, and role-criticality labels. Then calculate the canonical rate and segment it by technology stack, tenure, team, and replacement status.
TekRecruiter can support that workflow as a technology staffing, recruiting, and AI Engineer firm. Its process can be aligned to the data your organization already maintains, so leaders receive segmented dashboards rather than a single blended percentage. The operating outputs should include quarterly attrition reports, flagged risk roles, and backfill priorities matched to sprint and roadmap demands.
That approach also separates permanent hiring from staff augmentation. A full-time departure may require a long-term search, while a contractor bridge may protect delivery during the search. The two actions belong in the same capacity plan, but they shouldn't be confused in the attrition numerator.
For teams evaluating broader support, IT staffing services can connect workforce measurement with direct hire, staff augmentation, on-demand, and nearshore engineering capacity. The metric then becomes a forward-looking input to pipeline planning, not a retrospective score on a dashboard.
TekRecruiter helps companies deploy the top 1% of engineers anywhere through technology staffing, recruiting, and AI Engineer services. Visit TekRecruiter to connect attrition signals with qualified engineering pipelines, targeted backfills, and capacity planning for the roadmap ahead.
Comments